
Increasing Economic Inequality
Causes of Economic Inequality in the United States and How It Affects the Average American
Michael Kurek
6/25/202420 min read
Abstract
Economic inequality in the United States (U.S.) has profound impacts on everyday life for average Americans, affecting not only their physical and mental health but also their life outcomes and education. Companies and wealthy individuals should be limited in their political influence, causing regulatory changes to negatively affect the population in the U.S. Concurrently, financial differences should not impact an individual's right to food, water, shelter, healthcare, and education, which are all basic human rights and should not be suppressed for the intent of profit. Also, corporate and higher classes should be taxed accordingly. Income and other payment solutions such as company shares and taxes should be used to improve the health and well-being of its population, not to coerce and oppress other nations. Healthcare, insurance, and education corporations must be removed from their “middle-man” position in which they receive record profits for providing limited and abysmal services. Direct connection between the individual and the government for said industries is the best way forward for decreasing costs and increasing the quality of those services. In this research paper, we will analyze deregulation in the United States since the 1970s, economic hardship and inequality, and other systemic issues within American systems, and how these issues have affected the prosperity of the middle and lower classes.
Introduction
Since the early 1900s, market boom and bust cycles have had profound impacts on all Americans. The booming markets after World War II (WWII) may have closed the gap between the poor and the elite while growing the middle class as we knew it. But booms and busts since those few decades, along with other widespread issues, have widened that gap, including the 1987 crash and the tech boom/crash in the late ‘90s and early 2000s. Another strong example would be the great recession of 2008/09, which was fueled by the immoral banking system that puts profits before anything else. These issues fueled widespread inequality in the United States and other countries that are closely tied to the U.S. Sure, these market troughs affected the elite and wealthy as well, but they had a massive advantage: extreme wealth.
Delinquency rates (past due loans) on single-family residential mortgages spiked during and directly following the 2008/09 financial crisis, spiking to as much as 12.55% in quarter one of 2010 compared to an average of around 2% in the decade preceding. Increasing complexity in the U.S. markets has inevitably been another player in expanding the gap between the lower and upper classes. To add to this, corporate greed and profit-driven lobbying organizations further the deregulation of the U.S. economy to serve the rich and prohibit people from achieving a stable life in the middle class.
Banks in Crisis
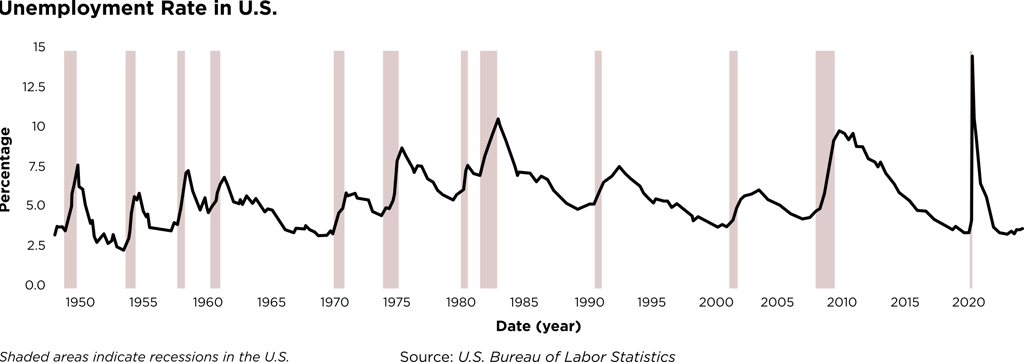
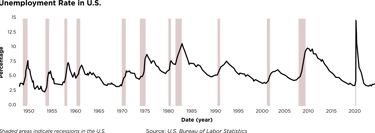
The 2008/09 financial crisis in the United States was a real turning point in people's understanding of the economy. Many noticed the blatant inequalities in wealth throughout the country and how much power banks and the wealthiest class hold. Banks were the root cause of the 20008/09 financial recession, which caused millions of Americans to foreclose on their homes and many more millions to lose their jobs. The unemployment rate was at one of its highest percentages in 2009, reaching 10%. Normally, the Federal Reserve Bank of the United States would try to keep the unemployment rate around the four percent mark. The highest unemployment rate in the U.S. since 1950 was in April of 2020, reaching a whopping 14.8% according to FRED data.
Family life and retirement goals were put on hold for the years following the 2008/09 recession. Some of the largest bank failures in U.S. history occurred during this financial recession. Three of the top 10 largest U.S. bank failures by total assets occurred in either 2008 or 2009, with the largest —Washington Mutual Bank— failing in 2008. In addition to the multiple large bank failures that occurred during this crisis, more banks (and larger ones) were bailed out by the U.S. government. In 2008, Congress authorized $475 billion to be used towards five program areas, one of which focused $250 billion to stabilize banking institutions, i.e. bailout banks that were on the brink of failing. Funnily enough, they were failing because of the situation they created. Part of these funds was also committed to stabilizing the U.S. auto industry, American International Group (AIG), and programs to restart credit markets, while only a meager $46 billion was used to help struggling families avoid foreclosures. Counting the six million homes lost to foreclosures during the great recession, the average home price in the middle of 2008 amounted to over $1.4 trillion going into foreclosure.
Corporate Fiduciary Duty
When considering the state of economic inequality in the United States, one might look at corporations’ lack of moral principles and the degree to which they pursue them. Even I look at companies and see immoral and overreaching institutions. Sadly, like everything else that will be discussed in this paper, it’s not as simple as it seems.
Corporations are understood as legally created entities with a statutory existence, meaning they were created by and follow state statutes. Legally, corporations have similar rights as individuals. There are only a few boxes a corporation needs to check to be considered a corporation: they need to have a purpose —something broad and flexible is best— and they need to have a stock par value. Corporations usually have shareholders, or owners and investors. And here is where it gets complicated: a board of directors, which most corporations include, has a fiduciary duty of loyalty to the shareholders. Their fiduciary duty (which is the highest duty they exercise legally) is to make the shareholders profit. This simple issue in our legal system pushes aside any pursuit of morals and prioritizes profits over everything else.
Is this enough knowledge of our legal system to try and change it? Changing legal definitions and statutes regarding corporations and their duties should be prioritized if we want to change the outcome of our system and its inequality.
Share of U.S. Aggregate Wealth & GDP
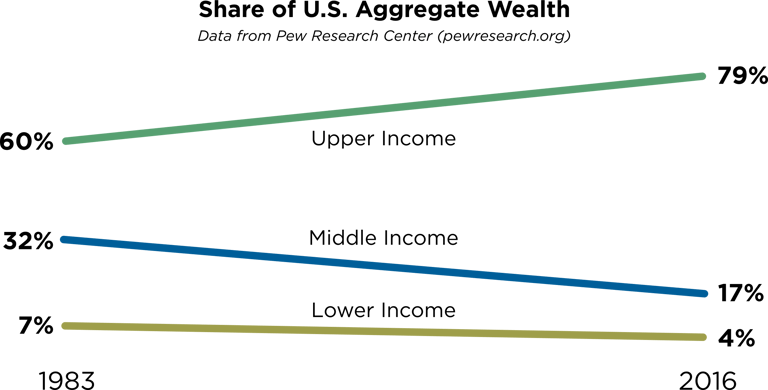
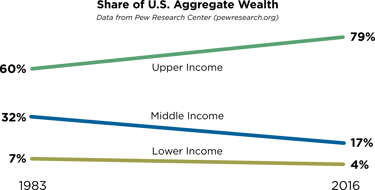
Since the 1980s, when modern deregulation efforts in the country began, the inequality gap between the top 1% and the other 99% has become increasingly wide. According to the Pew Research Center, since 1983, the upper-class share of U.S. aggregate wealth has increased from under 60% to over 79% in 2016. The United States is known to have widely increased its middle class in the 20th century, and it had created a position in the economy where you could work lower hours while still maintaining a comfortable lifestyle. This is known as the American dream: an idea spread by the wealthy, higher-up officials in the U.S. government, and anyone privy to the idea. It was an achievable standard, but since deregulation, increasing complexity, and lobbying grew in the U.S., this “dream” has become more and more unachievable.
The middle class itself has shrunk in size, with its share of U.S. aggregate wealth shrinking considerably. This is a worrying statistic: according to the Pew Research Center, in 1983, the middle class shared 32% of all U.S. aggregate wealth. In 2016, the same middle class now has a 17% share of all U.S. aggregate wealth. The lower income class went down to 4%, from 7% in 1983.
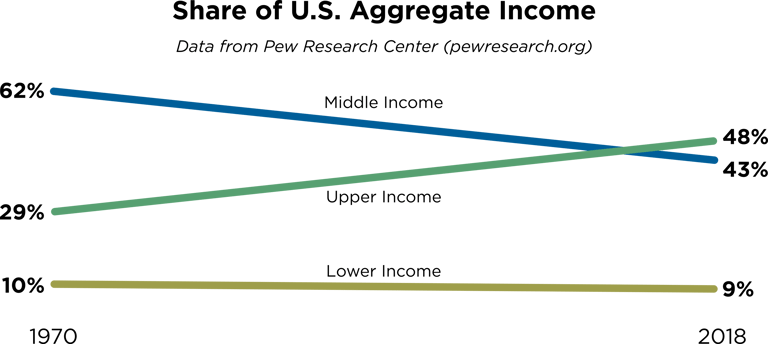
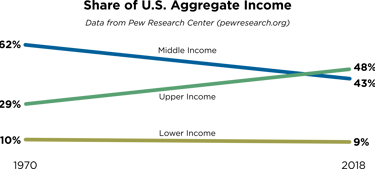
Another major issue is the share of U.S. aggregate income, which shows a heavy increase in share for the upper class and a decrease for both the middle and lower classes. The middle class's share of U.S. aggregate income decreased from 62% in 1970 to 43% in 2018, with the upper class taking all of that percentage change, going from 29% to 48%.
Aggregate wealth is defined as the sum of all net financial and housing wealth. This doesn’t mean the average income hasn’t gone up since then —GDP per capita has increased— but has it kept up with inflation? The U.S. real GDP, which is affected by inflation, seems to have risen extremely fast in the last couple of decades. If we pin the data to the year 1948 (to get a better understanding of inter-year changes), real GDP per capita is at 434.7 in quarter four of 2023.
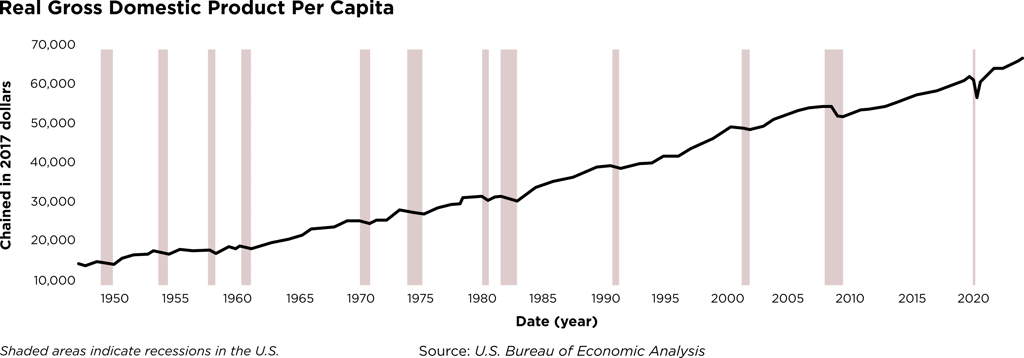
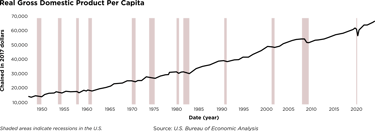
Although, this doesn’t look at individual overall wealth or prosperity very well. It only looks at a country's economic output per person and is calculated by dividing a nation's real GDP by its population. GDP per capita is raised immensely due to the top one percent’s insane net worth. In quarter four of 2023, the top one percent held 44.6 million billion dollars compared to just 30.3 million billion dollars in quarter one of 2020.
Median Family Income & Wealth
Some will argue that U.S. aggregate wealth in total has increased drastically, affecting everyone positively, even if your share of that wealth has decreased. According to the same Pew Research Study, the median middle-family wealth was $102,000 in 1983, $144,600 in 2001, and $115,200 in 2016. These numbers are adjusted in 2018 dollars.
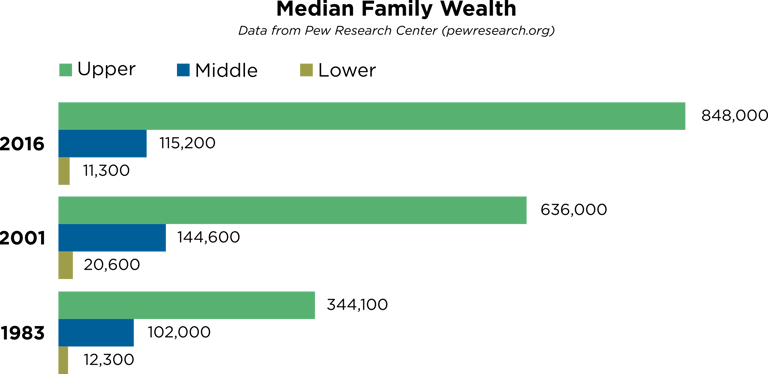
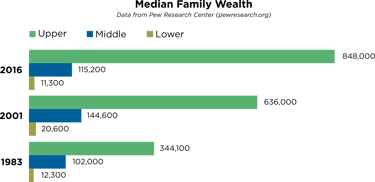
You can pinpoint a bit of a drop in the median middle-family wealth after the 2008/09 recession, can’t you? Technically, the middle-class median family wealth has increased from the year 1983 to 2016, but at an extremely gradual rate, and a considerably slow rate compared to the upper class. Upper-class median family wealth has increased, more than doubling from 1983 to 2016. All of this data can be seen on the Pew Research Center's website or U.S. government websites like FRED and census.gov. Income inequality in the United States is getting worse and has been since the 1980s. Establishing effective bills that limit the top one percent’s power in the U.S. government and economy should be of top priority for voters and politicians. Creating bills to limit corporations and lobbying organizations from funding political campaigns would help decrease bias in politics, helping the upper class and corporations.
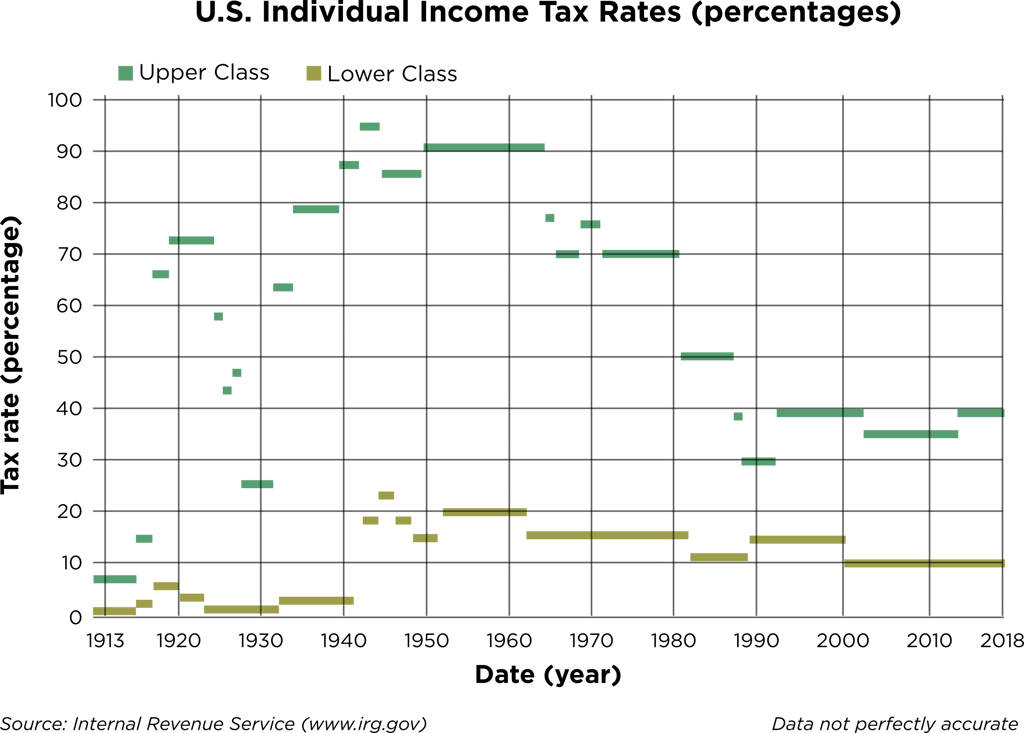
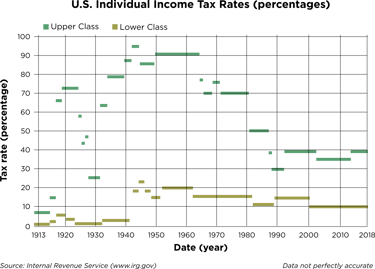
Corporate & Individual Tax Rates
If you’re still not certain about income inequality and how it’s gotten worse, let’s take a look at corporate tax rates. Corporate tax rates were at around 16 percent in 2014. This is arguably a decent percentage for corporations to pay their fair share, but that number declined to as low as 9 percent in 2018. In only four years, the corporate tax rates declined 7 percent. Thankfully, personal taxes have stayed relatively fair throughout history in the United States. Personal income tax for the lowest bracket hovered around 5% from 1913 to 1940, according to IRS tax stats data since the year 1913. The income tax for the lower classes increased throughout World War II (after 1940) and stayed around the 20% mark till the 60s. Since the 1960s, the lowest income bracket tax rate has declined and stayed at 10% from 2002 until now. The highest tax bracket has had a higher rate of change since 1913, starting at 7%, rather than 1%, and increasing to as much as 91% in the 1950s. They’ve since decreased as well and have stayed around the 35 - 37% range.
This is all surprising, seeing as the prior data in this paper shows income inequality widening in the U.S., yet the upper classes have paid significantly more in taxes as a percentage of their income. Sadly, this isn’t the best data to analyze. Most of the upper class's pay is tied up in other payment solutions from their company, like stocks and other nontaxable ways. This is mainly how the rich avoid paying so much in taxes. Famously, Steve Jobs of Apple, Larry Ellison of Oracle, and Elon Musk of Tesla have had $1 salaries in the past, even as CEOs of multi-billion dollar companies. When looking at other nations worldwide, their citizens enjoy, or at the very least understand that paying taxes is an important part of a well-functioning and fair economy.
CEO to Worker Pay Ratio
So, if individual tax rates aren’t to blame for the widening income inequality, then what is? One issue, brought up by past presidential candidate and current U.S. Senator Bernie Sanders, is the gap between employee pay in a company and that company's CEO pay. This also includes other officers' pay, like the CFO or COO, and the board of directors. According to the Economic Policy Institute, the CEO-to-worker compensation ratio has increased dramatically since 1965. In 1965, the realized CEO compensation ratio was at just 20.7, which most would think is a fair ratio. However, it has increased to 344.5 in 2022, which is a startling statistic.
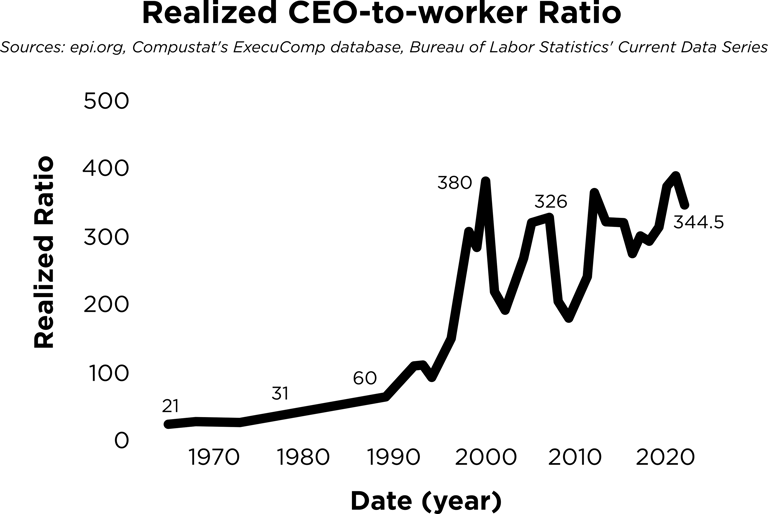

This means that the average CEO of a “top 350 largest U.S. firm” makes almost 345 times that of its average employee. Likewise, according to EPI-received data, CEO pay itself has skyrocketed by 1,460% since 1978. There have been proposals to fix this and cap the amount a CEO can get paid compared to their employees. The bill that Sanders is backing, the Tax Excessive CEO Pay Act, proposes to impose tax increases on companies with a CEO-to-median-worker pay ratio of greater than 50:1. Another important part of this, said by Bernie’s team themselves, would be that “if the CEO did not receive the largest paycheck in the firm, the ratio will be based on the highest-paid employee”. This would help income inequality and other disparities in the economy, as pay for the highest has increased at a rate never seen before in the U.S.’s rather short history.
Personal Expenses
The actual pay of the lower and middle classes is either decreasing or slowing down compared to that of the upper class. That’s the income side of things, and it isn’t improving, but what about the other side of personal finances: expenses? How much do things cost now, and how is the balance between income and expenses for the average American? Below is a chart showing real disposable income per capita (bottom line), and the median sale price of homes sold (top line).
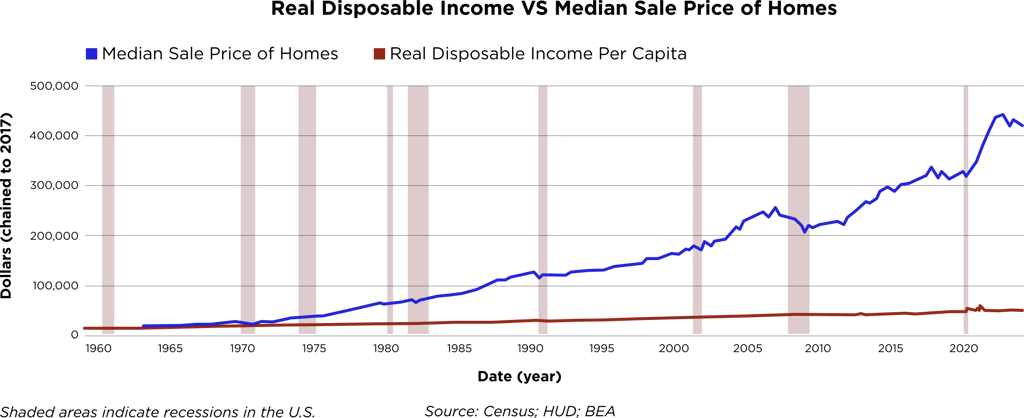
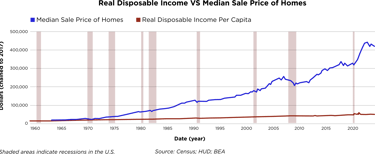
Back in 1967, the median home price was just 1.33 times the real disposable income per capita. That’s achievable, right? It was for many within the rising middle class in the early and mid-20th century in the United States. This same data shows that the median home price in quarter four of 2023 was —wait for it— 8.32 times the real disposable income per capita. Renting a home is another option, but rent prices have increased an incredible amount. According to Trading Economics, rent inflation grew from an average of around 2.5% in the last decade to over 8% in 2023. The last big boom in rent inflation was during the 1970s stagflation period, and in the 1980s during the oil crisis.
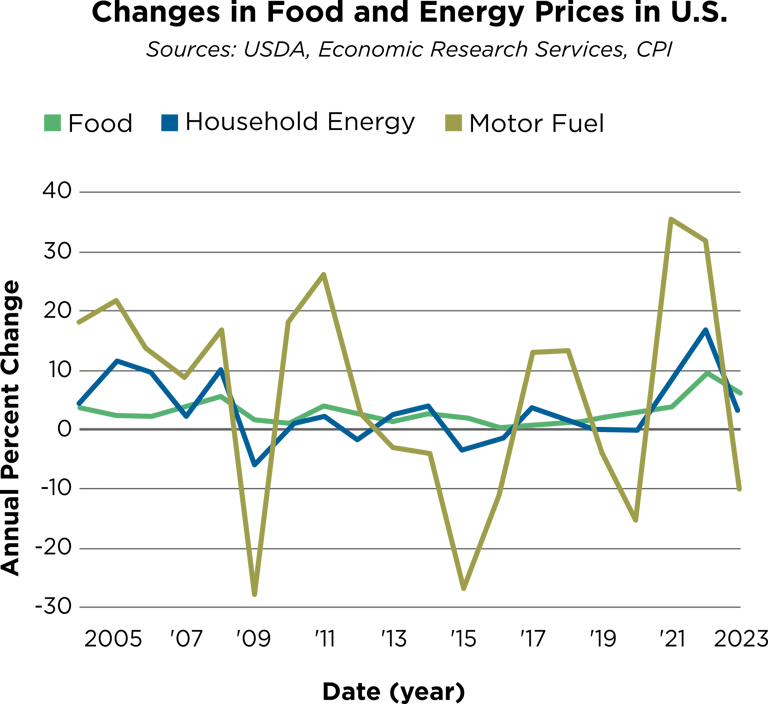
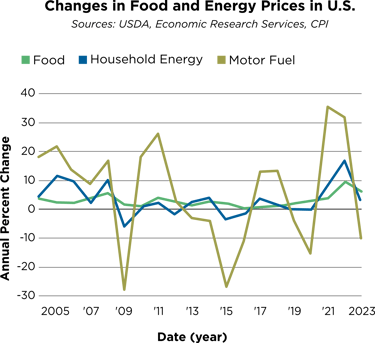
Other important expenses for individuals are food and drug prices, which are both necessities. Food prices have seen a staggering increase in annual percentage changes over the past few years. According to the USDA, annual food price changes in the past two decades remained around the 3% mark. In 2023, they grew by 5.8%, reaching an 8.5% inflation point. Motor fuel prices are usually the most volatile, and the chart below confirms this, as fuel prices have gone through double-digit annual price swings over the past two decades.
Since 1980, the nationwide spending per capita on prescription drugs purchased from pharmacies has increased by around 483% according to the Congressional Budget Office, a nonpartisan analysis for the U.S. Congress. A policy set in place by the Biden-Harris Administration states, “The Inflation Reduction Act requires drug companies to pay rebates to Medicare when prices increase faster than the rate of inflation for certain drugs. CMS intends to begin invoicing prescription drug companies for rebates owed to Medicare no later than fall 2025.” Hopefully, this act will ensure companies keep drug prices down, especially for essential prescription drugs, in order to help Americans deal with high costs of living.
Homelessness
Currently, homelessness in the United States is a concerning issue. Over 300,000 people in the United States experience homelessness and are living in shelters. There are many reasons for the homelessness problem in the United States: home and rent costs, inflation on necessities like food and water, lack of an emergency fund for families, and a lack of Federal and State funding for homeless shelters and other means to help families pay for a home.
The rising immigrant population in the United States is also an increasing issue, especially in states neighboring Mexico. Personally, I stand by letting immigrants into the United States, not only from a humanitarian view but also from an economic perspective: to increase our workforce and help balance the population pyramid. A nation's economic health is heavily based on the age of its population. This is evident in the struggling economy in Japan with its current unbalanced population pyramid. Taxes pay for Social Security benefits and other government spending operations. As a population gets old and retires, more people are collecting benefits rather than putting money into the tax pool. Japan is an extreme example of this, but the United States is nearing this same issue.
Allowing immigrants into the United States through legal means (which need to be improved and quickened), should be a focus of the government, rather than closing off our borders. Republicans argue for a stronger economy while simultaneously wanting to strengthen our border policies. Tightening our border and restricting immigration will only hurt our economy, as immigrants fill jobs and increase our population.
Mental & Physical Health
Income inequality is a persisting issue, and it’s getting worse. Aside from finances, how does this affect the average American? Our economy and political issues create relentless dissatisfaction in our careers and lives. The way things are set up means that if you aren’t financially stable, then your health (mental or physical) and general happiness will be negatively affected. A study done by the Pew Research Center shows that 31% of the lower class and 18% of the middle class said they are “generally not too happy about things in their lives”, compared to only 10% of the upper class saying so. Similarly, 40% of the lower class and 22% of the middle class say their health is generally fair to poor, compared to only 10% of the upper class. Stress is even more prevalent in the lower classes in America, with 58% of the lower class and 37% of the middle class saying they are frequently stressed in life. To differ, only 29% of the upper class says they are stressed.
Lower classes in society have continuously stressed that they are not advancing in their careers, according to the same study. Finances have a major impact on our mental health, and ultimately end up affecting our physical health as well. Should this be the status quo for Americans? According to the Organization for Economic Co-operation and Development (OECD), the United States ranks fourteenth in life satisfaction, behind Australia, Israel, New Zealand, and a handful of European nations.
Education
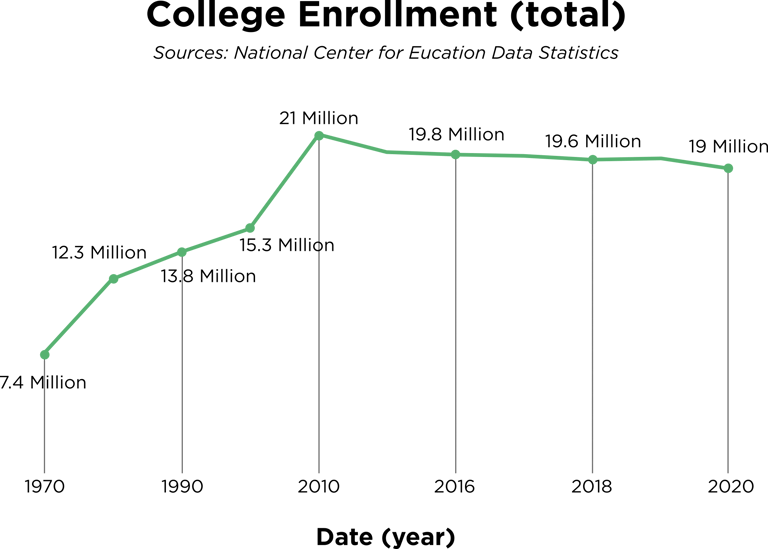
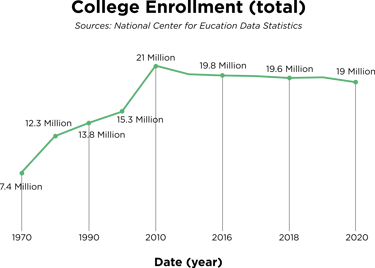
Besides shelter and life satisfaction, education also heavily influences society and individuals. Education is “the most powerful weapon which you can use to change the world”, according to Nelson Mandela. So, you would think something as significant as education would be provided to individuals at little or no expense, right? According to the OECD, Korea is number one in tertiary education rates among 25 to 34-year-olds. The United States is in fourteenth place, ranking behind Ireland, Australia, Japan, Canada, and many other nations. College enrollment in the United States has lowered a bit since its peak in 2010.
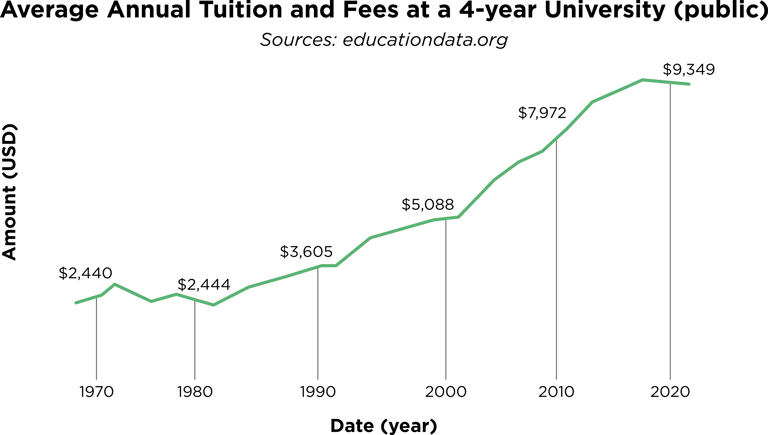
Having the sixth-highest GDP per capita and the highest GDP globally, shouldn’t the United States boast higher life satisfaction and tertiary education rates? What is causing the United States to fall short on providing an easy path toward education and a happier life? University costs are becoming overwhelming for many Americans. Adjusted for inflation in 2020 dollars, the average annual tuition and fees at a 4-year public institution has increased 283.16% since 1970.
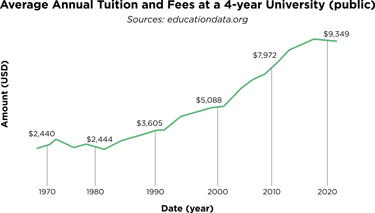
Part of this can be attributed to fewer incentives for universities to drop college tuition costs. Government loans are becoming easier for students to receive, leading to a (mostly) guaranteed payment to the colleges while leaving students to make hefty payments for decades after graduation. Some ideas have been proposed to help make college more affordable, like incentives for universities to lower costs or eliminating interest on student loans. Current U.S. Senator Bernie Sanders proposes “The College For All Act”. This bill would eliminate tuition and fees at public four-year colleges and universities for those making up to $125,000, and it would make community college tuition and fees free for all. The total estimated cost of this legislation would be around the $600 billion mark, and the major plan would be to tax Wall Street by imposing fees on stock trades, bonds, and derivatives.
Government Spending
An issue people constantly complain about is how terrible our government is at spending our tax dollars. Every nation makes its citizens pay a percentage of their income in taxes and then adds taxes on top of sales for goods and services.
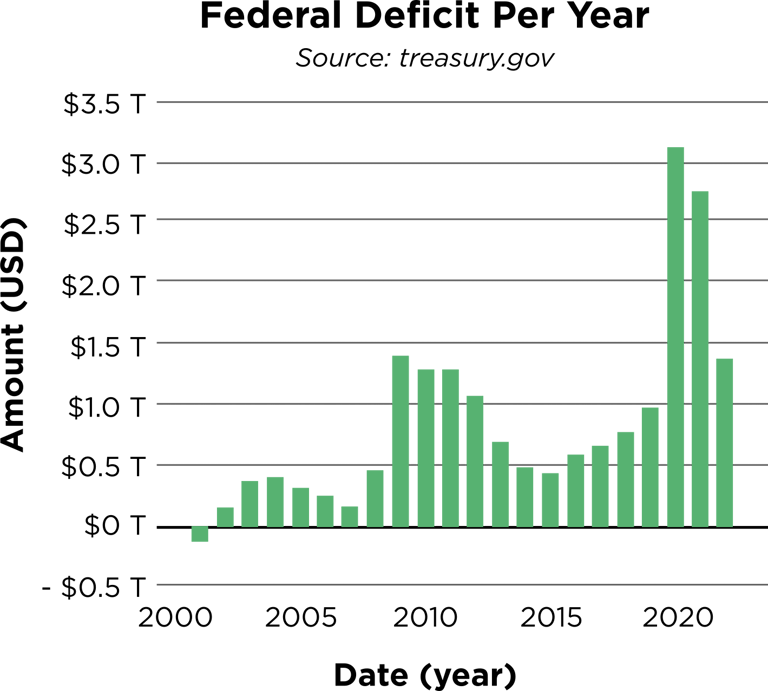
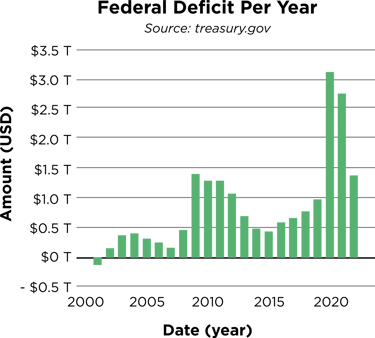
The United States generates a ton of tax revenue. It spent 6.13 trillion dollars (or 23% of GDP) in 2023, which is more than it collected through taxes, resulting in a deficit. In 2024, 13% of U.S. government spending went to national defense. That’s more than what was spent on veterans’ benefits, education, transportation, and commerce/housing credit combined. The year 2020 saw a massive increase in government spending, mainly because of the COVID-19 pandemic. In 2020, the U.S. government spent $7.72 trillion, a hefty 31% of the nation’s GDP, compared to in 2015 when the government spent $4.75 trillion, or 20% of the nation's GDP. Since the 1930s, government spending has increased significantly compared to U.S. GDP. Yearly spending deficits have been continuously increasing since the 1930s as well. The current U.S. national debt is at $34.8 trillion, which equals about $103,343 per citizen. Below is a chart showing the yearly deficit of the U.S. federal government since 2001. According to the U.S. Treasury, “the last surplus for the federal government was in 2001”.
Conclusion
There are staggering issues in the United States that are changing what it means to be an American. Deregulation efforts mirror the widening inequality gap. We’re falling behind countless other nations in health, personal finances, and education, yet we’re the most wealthy by GDP and at the top with other national wealth standards like PPP. We’re told our economy is pumping ahead, creating record job openings, increasing overall pay, and eliminating poverty; However, this isn’t what the data shows. The data shows that Americans are worse off than they were almost a century ago. We are continuously reminded that education and health are falling behind in the United States, while the wealthy create better lives for themselves. We can’t change these issues as easily as we once could, as politicians are constantly brought into or bought off by the upper class. Political Action Committees and lobbying groups have grown extremely powerful, with organizations and major U.S.-based international companies pouring billions into Washington D.C. to make the economy work more in their favor. The votes of Americans have become increasingly less influential in the outcome of our elections and politicians' decisions. Taxes are spent on an overly powerful military-industrial complex. The U.S. spends as much on its military as the next nine nations combined, with a few billion dollars left over. Most nations of which are our close allies.
How can these ongoing issues be solved? Educating yourself on these issues and how you can make a change can be a great starting point for redirecting our economy. We should prioritize voting for candidates who we know will make a change for the better, not those who we hope will make a change. The best way to make sure you vote for the right candidate in any election, local or national, is to educate yourself on every candidate's beliefs and their solutions to ongoing problems. Ranked choice voting would help create a better election situation in the U.S. It is important to get involved in discourse with others and to try to seek the truth in any situation.
It’s also helpful to be knowledgeable in your personal finances and know where to put your money if a recession is looming. Unfortunately, it is becoming increasingly more difficult, if not impossible, to make it from the lower class to the upper class in America. Many cold-hard facts support this notion. Whether you believe it or decide to try to fix the issues is up to you. I hope this article helps to cement in everyone the will to do something about it, even if it means voting for someone you normally wouldn’t.
References
Bivens, Josh, and Jori Kandra. 2022. “CEO Pay Has Skyrocketed 1,460% since 1978: CEOs Were Paid 399 Times as Much as a Typical Worker in 2021.” Economic Policy Institute. Economic Policy Institute. October 4, 2022. https://www.epi.org/publication/ceo-pay-in-2021/.
Board of Governors of the Federal Reserve System (US). 1989a. “Share of Total Net Worth Held by the Top 1% (99th to 100th Wealth Percentiles).” FRED, Federal Reserve Bank of St. Louis. July 1, 1989. https://fred.stlouisfed.org/series/WFRBST01134.
———. 1989b. “Total Net Worth Held by the Top 1% (99th to 100th Wealth Percentiles).” FRED, Federal Reserve Bank of St. Louis. July 1, 1989. https://fred.stlouisfed.org/series/WFRBLT01026.
———. 1991. “Delinquency Rate on Single-Family Residential Mortgages, Booked in Domestic Offices, Banks Ranked 1st to 100th Largest in Size by Assets.” FRED, Federal Reserve Bank of St. Louis. January 1, 1991. https://fred.stlouisfed.org/series/DRSFRMT100N.
“CEO Pay Slightly Declined in 2022: But It Has Soared 1,209.2% since 1978 Compared with a 15.3% Rise in Typical Workers’ Pay.” n.d. Economic Policy Institute. https://www.epi.org/publication/ceo-pay-in-2022/#fig-a.
Congressional Budget Office. 2022. “Prescription Drugs: Spending, Use, and Prices | Congressional Budget Office.” Www.cbo.gov. January 2022. https://www.cbo.gov/publication/57772.
DeSilver, Drew. 2023. “Most U.S. Bank Failures Have Come in a Few Big Waves.” Pew Research Center. April 11, 2023. https://www.pewresearch.org/short-reads/2023/04/11/most-u-s-bank-failures-have-come-in-a-few-big-waves/.
“Fiscal Data Explains Federal Spending.” n.d. Fiscaldata.treasury.gov. https://fiscaldata.treasury.gov/americas-finance-guide/federal-spending/#:~:text=Visit%20the%20national%20deficit%20explainer.
FRED. 2023. “Unemployment Rate.” Stlouisfed.org. 2023. https://fred.stlouisfed.org/series/UNRATE.
Hanson, Melanie. 2022. “Average Cost of College by Year.” Education Data Initiative. January 9, 2022. https://educationdata.org/average-cost-of-college-by-year.
———. 2024. “College Enrollment & Student Demographic Statistics.” Education Data Initiative. January 10, 2024. https://educationdata.org/college-enrollment-statistics.
Horowitz, Juliana, Ruth Igielnik, and Rakesh Kochhar. 2020. “Trends in U.S. Income and Wealth Inequality.” Pew Research Center. January 9, 2020. https://www.pewresearch.org/social-trends/2020/01/09/trends-in-income-and-wealth-inequality/.
Morin, Rich, and Seth Motel. 2012. “A Third of Americans Now Say They Are in the Lower Classes.” Pew Research Center’s Social & Demographic Trends Project. September 10, 2012. https://www.pewresearch.org/social-trends/2012/09/10/a-third-of-americans-now-say-they-are-in-the-lower-classes/.
“NEWS: Sanders and Colleagues Introduce Legislation to Combat Corporate Greed and End Outrageous CEO Pay» Senator Bernie Sanders.” n.d. Senator Bernie Sanders. https://www.sanders.senate.gov/press-releases/news-sanders-and-colleagues-introduce-legislation-to-combat-corporate-greed-and-end-outrageous-ceo-pay-2/#:~:text=I.
OECD. 2016. “OECD Better Life Index.” Oecdbetterlifeindex.org. 2016. https://www.oecdbetterlifeindex.org/topics/life-satisfaction/.
———. 2023. “Education Attainment - Population with Tertiary Education - OECD Data.” OECD. 2023. https://data.oecd.org/eduatt/population-with-tertiary-education.htm.
Office, ASPA Press. 2024. “HHS Announces Savings for 41 Prescription Drugs Thanks to Inflation Rebates from the Biden-Harris Administration’s Lower Cost Prescription Drug Law.” Www.hhs.gov. March 26, 2024. https://www.hhs.gov/about/news/2024/03/26/hhs-announces-savings-41-prescription-drugs-thanks-inflation-rebates-from-biden-harris-administrations-lower-cost-prescription-drug-law.html#:~:text=The%20Inflation%20Reduction%20Act%20requires.
Office, U. S. Government Accountability. 2022. “Corporate Income Tax: Effective Rates before and after 2017 Law Change | U.S. GAO.” Www.gao.gov. December 14, 2022. https://www.gao.gov/products/gao-23-105384.
SIPRI. 2022. “SIPRI Military Expenditure Database | SIPRI.” Sipri.org. 2022. https://www.sipri.org/databases/milex.
“THE COLLEGE for ALL ACT Cuts Student Loan Interest Rates in Half.” n.d. https://www.sanders.senate.gov/wp-content/uploads/the-college-for-all-act-fact-sheet.pdf.
U.S. Bureau of Economic Analysis. 1947. “Real Gross Domestic Product per Capita.” FRED, Federal Reserve Bank of St. Louis. January 1, 1947. https://fred.stlouisfed.org/series/A939RX0Q048SBEA#0.
U.S. Census Bureau, and U.S. Department of Housing and Urban Development. 1963. “Median Sales Price of Houses Sold for the United States.” FRED, Federal Reserve Bank of St. Louis. January 1, 1963. https://fred.stlouisfed.org/series/MSPUS#0.
U.S. Department of the Treasury. 2023. “Troubled Asset Relief Program (TARP).” U.S. Department of the Treasury. October 26, 2023. https://home.treasury.gov/data/troubled-asset-relief-program.
“United States Rent Inflation - February 2022 Data - 1954-2021 Historical.” 2022. Tradingeconomics.com. 2022. https://tradingeconomics.com/united-states/rent-inflation.
“What Is the U.S. National Debt Right Now — and Why Is It so High?” Www.pgpf.org, www.pgpf.org/national-debt-clock#:~:text=The%20%2434%20trillion%20(and%20growing.
Bureau, US Census. 2024a. “New Survey Data Provides Demographic Profile of Population Experiencing Homelessness Who Lived in Emergency and Transitional Shelters.” Census.gov. February 27, 2024. https://www.census.gov/library/stories/2024/02/living-in-shelters.html.
“Food Prices Are Less Volatile than Fuel Prices.” n.d. 199.135.94.241. https://www.ers.usda.gov/data-products/chart-gallery/gallery/chart-detail/?chartId=58358.


Please be aware that the following disclaimer pertains to Market Mornings LLC. The content presented on this platform is intended solely for educational and informational purposes and should not be construed as financial advice or professional advice of any kind. Market Mornings LLC does not present or endorse any investment advice, recommendations, or opinions regarding the suitability, value, or profitability of specific investments or trading strategies. Any investment decisions made based on the information available on this platform are undertaken at your own risk. It is advisable to seek the counsel of a licensed financial advisor or professional before making any investment decisions.
Market Mornings LLC makes no guarantees regarding the accuracy or completeness of the information or analyses provided on this platform. The content is subject to change without prior notice and may not reflect the most current information. Engaging in trading carries substantial risk, and there is a potential for the loss of your entire investment. Past performance does not guarantee future results. Market Mornings LLC disclaims responsibility for any losses, damages, or liabilities whatsoever resulting from your use of the information on this platform.
By accessing this platform, you agree to indemnify, defend, and hold harmless Market Mornings LLC, its officers, directors, employees, and affiliates from and against any claims, damages, liabilities, or expenses arising from your use of the information provided herein. The terms and conditions of our website shall apply to this disclaimer.
The views and opinions expressed in the blog posts on this website are those of the respective authors and do not necessarily reflect the official policy or position of Market Mornings LLC. The content provided in these blog posts is for informational purposes only and should not be considered as financial advice. Readers are encouraged to conduct their own research and consult with a qualified financial advisor before making any investment decisions. Market Mornings LLC shall not be held liable for any losses, damages, or liabilities whatsoever arising from the use of information presented in the blog posts. The terms of our general disclaimer and the terms and conditions of our website shall apply to this disclaimer.